Code Connect Prototype

It’s been a few months since I introduced the idea behind Code Connect. Code complexity has been increasing for decades, but the tools we use to manage this complexity have largely stagnated. It’s hard for a programmer new to a large project to understand what’s going on in a maze of abstraction and function calls that span hundreds of files, and thousands of lines. Many of us either insert a breakpoint and trace execution using the debugger or resort to writing out function calls by hand.

Why are we using the debugger to understand a codebase? Why are we resorting to pen and paper while sitting in front of a machine that can easily understand our source code? We essentially resort to “playing computer” when we try to understand code execution paths using only our mind. This approach is dated and makes no sense.

Code Connect strives to solve these problems by dynamically visualizing function calls as you develop. For the first time, we’re finally ready to show off our progress and hear your feedback.

If you’d like updates on our progress, sign up at http://codeconnect.io

Why Roslyn is a BigDeal™

Microsoft’s new C# compiler Roslyn has been in the pipeline for quite some time. Eric Lippert first put out a call for developers to work on Roslyn back in 2010, when we worked with C# 3.0 and built our own state machines to handle aynchronous function calls. 

So it’s safe to say that Roslyn has been on the team’s mind for well over three years. Roslyn obviously marks a large investment on behalf of Microsoft. So why take the time to rearchitecture the C# and VB compilers? After all, software rewrites have typically been at the top of on the list of “Things You Should Not Do”.

Most people familiar with Roslyn understand that it marks the first real change in compilers in recent memory. For decades, compilers operated as black boxes that took source code in, and spit out binary, ByteCode or IL. Short of building your own compiler, there was no easy way to peek at the syntax tree or reason about the semantics of a codebase. Roslyn opens the compiler up, making syntactical and semantic structure available to average developers who don’t want to write a feature-complete compiler just to create a Visual Studio plugin.

So the questions surrounding Roslyn boil down to: “What can I build now, that I couldn’t before”.

Intelligent Tooling

Roslyn allows developers to reason about the code in an intelligent manner. No longer are extensions forced to deal with a codebase as a set of files containing strings. From the perspective of the extension, a C# solution is made up of pieces of syntax and structure at varying levels of granularity. Need to find all method invocations within a given document? No problem, simply crawl the syntax tree looking for all syntax of type InvocationExpressionSyntax. Need to find that method’s declaration? No problem, simply pass that InvocationExpressionSyntax to the document’s SemanticModel.

We’ve been using this exact approach to build CodeConnect, a Visual Studio extension in which users edit functions rather than files.

overview

Roslyn allows us to quickly find all invoked functions within a given function and lay them out for a user. This kind of project would only have been possible had we built our own parser and lexer and built an internal representation of a given codebase. It would have needed to be fault tolerant and handle temporary errors as users typed their code. It would have had to waste clock cycles compiling code Visual Studio had already compiled internally.

Scripting Engine

I’m equally excited about Roslyn’s Scripting Engine, despite only having toyed with it briefly. The ability to compile, analyze and execute arbitrary code seems incredible. Already, individuals have worked to develop plugins that execute code as you’re developing,  in the style of Brett Victor. While I think it’s a difficult solution to generalize, I would not be surprised if we see a feature-complete, LightTable-esque approach to this problem once individuals become more familiar with the Scripting Engine.

In short, I expect Visual Studio’s tooling to improve dramatically once Roslyn ships. Roslyn has lowered the barrier to entry when it comes to writing intelligent, useful extensions for Visual Studio. I expect we’ll see a number of exciting tools be created that dramatically change the way in which we interact with our code.

I’m looking forward to tools and plugins that go beyond simple renaming refactoring and enforcing coding standards. I’m hoping the C# community can churn out some really cool tools that change the way in which we write code altogether.

Check out http://codeconnect.io for our take on making interesting plugins for Visual Studio.

Interested in playing around with Roslyn? Learn Roslyn Now!

Introducing Code Connect

Code Connect has been and idea that a classmate (Amadeus) and I have been talking about for the past year and a half. After seeing demos for Code Bubbles, Debugger Canvas, Light Table and watching a number of Brett Victor talks, we agreed that something had to be done about the state of programming. Dumping ASCII into text files quickly gets cumbersome. While tooling has improved over the years, we haven’t seen a major overhaul of text editors or IDEs.

Code Connect is our attempt to “fix” programming. It’s a plugin we’re developing for Visual Studio that allows you to retain all the benefits you’ve come to enjoy from that IDE. (For example, I love VsVim and Amadeus loves ReSharper). We believe you shouldn’t have to give up years of progress to take advantage of these new features.

We’re working hard to get a demonstrable prototype out by the end of February as part of our fourth year design project at the University of Waterloo.

Reverse Engineering Financial Data Sources

One of the enduring frustrations of working in financial computing is the difficulty involved finding accurate and detailed sources of financial data. While free options such as Yahoo Finance and Edgar Online exist, the finest granularity they allow is that of daily stock prices. As a student who wishes to test out intraday trading strategies to learn more about capital markets, these sources don’t fulfill that need.

However, with a little bit of work and Wireshark, we should be able to scrape together the data we need.

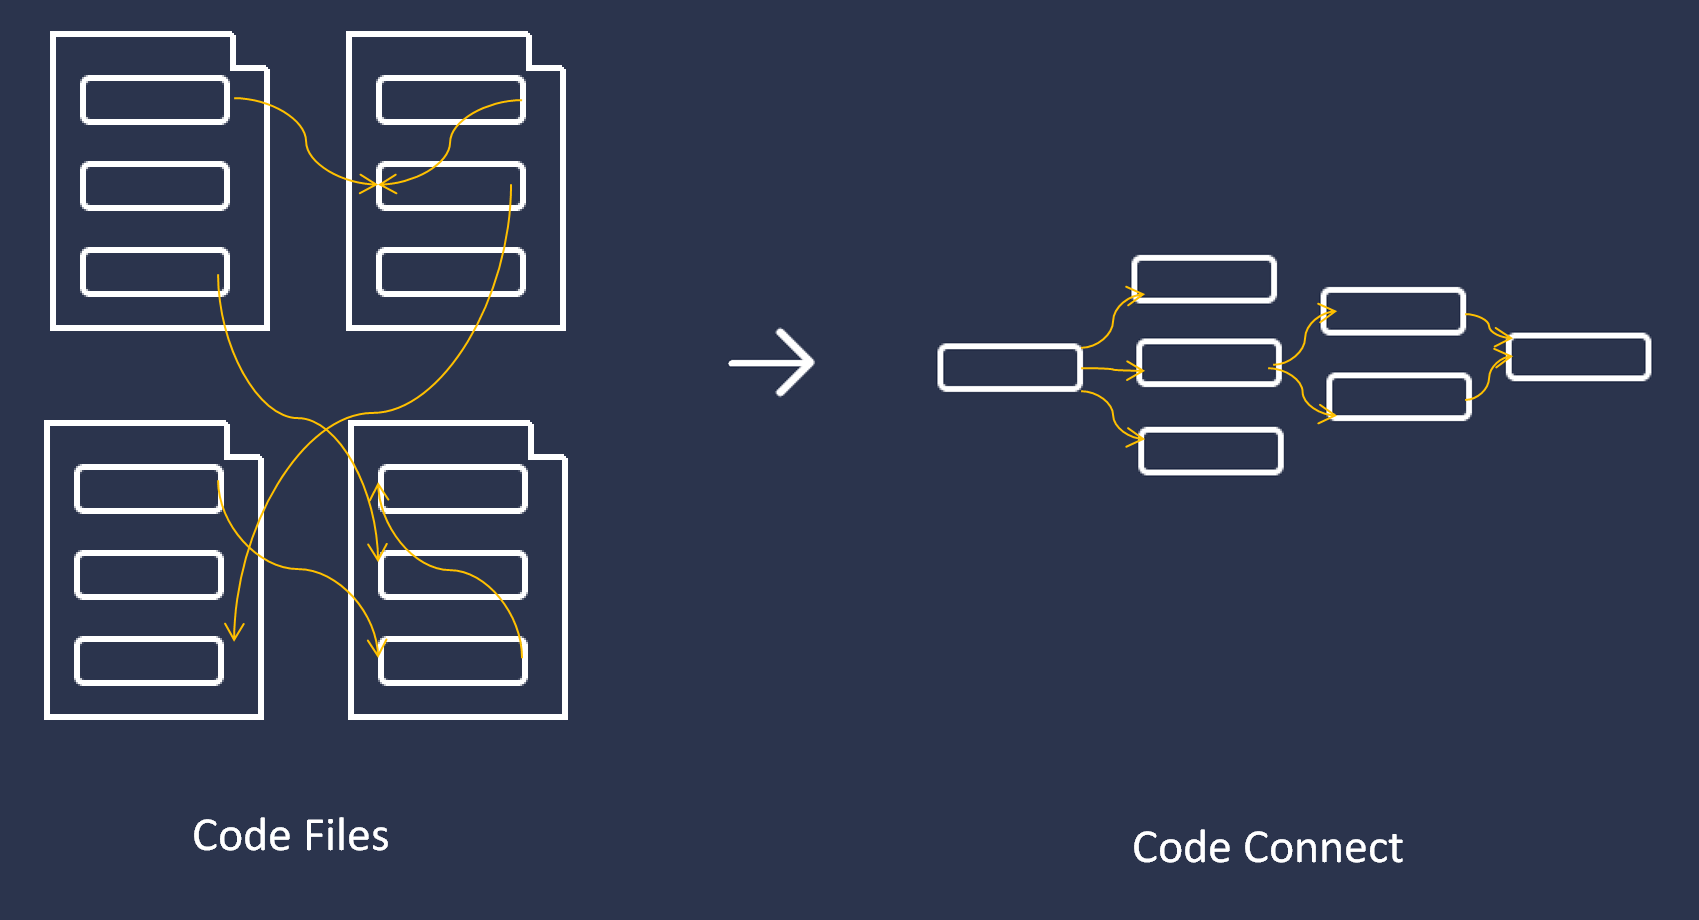
The first thing to remember when looking for alternative sources of financial data, is that most online financial charting services are making background calls, retrieving the financial data we desire and then displaying the data in a way they see fit. It is our goal to cut out their software, and use the raw data in a way that we see fit.

One such provider is ADVFN, who allows freely registered members to chart historical intraday data as shown below using the ticker symbol GOOG. (Note: Unfortunately, you’ll have to enable Java in order to use their website)

It’s not beyond reason to suspect a website would generate a chart like this at the server and simply send that image to the client to display. However, after playing with this chart it becomes clear the data is manipulated locally. Data appears to be dynamically loaded and then cached to prevent further requests. This applet also allows one to display price history in the form of a candlestick chart. This tells us that at a bare minimum, the applet receives a stock’s:

  • Open Price
  • High Price
  • Low Price
  • Close Price
  • Time of Trade

These five pieces of information will be useful to us when we try and reverse engineer the process in which data is sent to the applet.

The next step is to boot up Wireshark and obtain a network trace when we visit this page and load a chart. After approximately 13 TCP connections are opened (I’m not entirely certain why) we see a number of requests to /p.php with varying parameters. It seems as though ADVFN chooses to use these parameters in place of a traditional URL schema. Requests can be seen going to:

/p.php?pid=javadisabled
/p.php?java=chartinfo
/p.php?java=symbol
/p.php?java=memoload
/p.php?pid=pricehistory

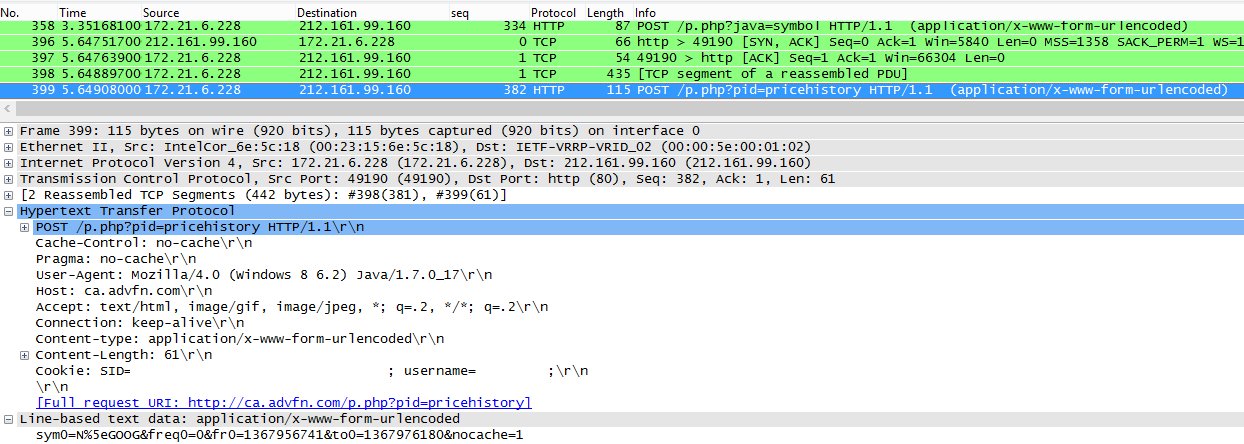
The last one is important to us and can be seen below:

The URL decoded parameters posted to /p.php?pid=pricehistory are:
sym0=N^GOOG
freq0=0
fr0=1367956741
to0=1367976180
nocache=1

The first parameter “sym0” obviously represents the ticker symbol we’ve specified. The second parameter “freq0” represents the frequency of stock prices, with 0 representing an interval of one minute. “fr0” and “to0” represent the earliest and latest times we desire in Unix time. The final parameter “nocache” likely specifies whether or not data is expected to be cached by the applet.

To quickly follow this TCP Stream, we can simply right click the request to /p.php?pid=pricehistory and choose “Follow TCP Stream”. This shows us the series of requests and responses that send the price data to the applet.

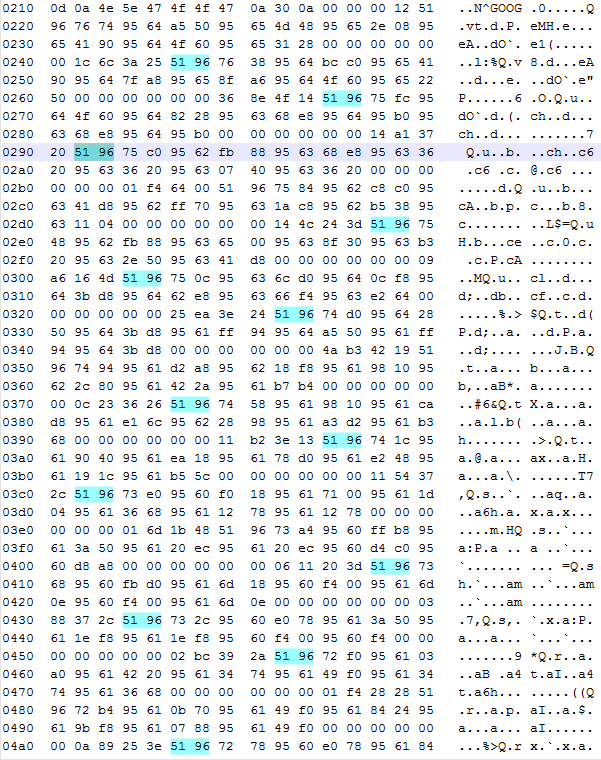
Here we can see that the server replies with a large blob of binary, that makes little sense when converted to ASCII. Other than N^GOOG, which we can recognize from the request, this representation gives us little to go on. As we know there should be a number of times and price points in this blob, we should do our best to look for repetition in the stream as a starting point. (Note: periods don’t count, as they represent a variety of characters which aren’t nicely represented in the basic 128 ASCII characters).

The first character to catch my eye would have to be Q (0x51). It turns up fairly often, but more importantly, it shows up consistently throughout the response. This tells us that it might be used as a delimiter, or some sort of repeated data. It obviously doesn’t map to ASCII and doesn’t make immediate sense as hexadecimal, so perhaps it is better represented in decimal. It is likely part of a larger sequence of binary digits, so I’ll grab the first six bytes (0x 51 96 74 d0 95 64) and play around with them.

When I try and figure these things out, I’ve actually found that the children’s website Math Is Fun has the best system in place for converting between bases easily. It allows one to strip digits from the binary, decimal and hexadecimal representations of numbers instantly, without forcing us to wait for a POST or click a button.

Starting from the last digit, I chose to remove one hexadecimal character at a time until I saw something that I recognized as a time or price. Below, keep your eye on the decimal representation.

The final decimal number 1368814800 certainly looks familiar. A quick trip to Unix Time Stamp confirms that this is the Unix Time for 05 / 17 / 13 @ 1:20:00pm EST.

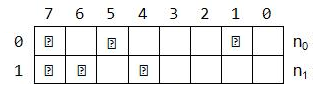
Next, we can take the hexadecimal output from Wireshark and throw it into Notepad++. If we highlight the first two bytes of any single timestamp, we can highlight all occurrences of these two bytes in the entire file.

hex dump

Closer inspection confirms that each timestamp is one minute greater than the last. Visually, we can see separate blocks in which different timestamps exist. Now we simply need to figure out how price information is represented in each of these blocks. We know next to nothing about the format of these numbers. They could be stored as doubles, as scaled integers or even be some proprietary numeric representation. What we do know is that we’re looking for four prices in the range of $900.00 – $905.00.

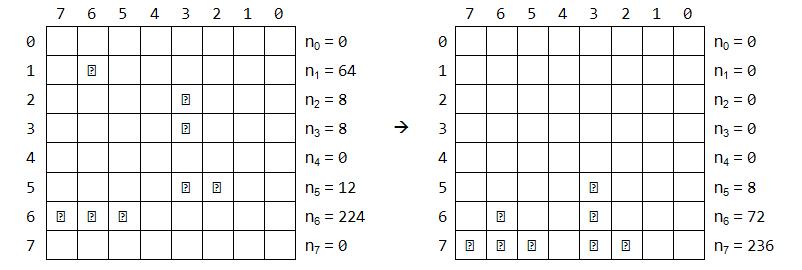
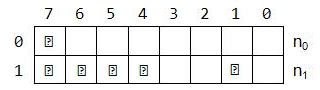
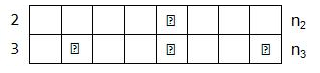
To start, we take a look at a single block, shown below:

The first four hexadecimal numbers following the timestamp are (0x 95 62 fb  88). This translates to 2506292104 in decimal, which means nothing to us. After playing around with the binary converter some more, I noticed that if we take the 28 least significant bits of this number, we are given the value 90373000. Now, I’m not personally familiar with any standard for numbers represented in 28 bits, but let’s continue with the other groupings.

We can compare these prices to those on May 17, 2013 @ 1:24:00 pm. Doing this tells us that last four prices correspond to the open, high, low and close prices, respectively.

At this point, we have all the price information we set out to attain, but some questions remain:

  • Why are these values represented using 28 bits? Possible reason?
  • Do the last 11 bytes we haven’t looked at correspond to volume?
  • What do the first two prices represent?

Solving Someone Else’s Bitwise Operator Homework

Here’s an interesting question I came across on Stack Overflow the other day regarding bitwise operations.

The question looks simple enough at first glance, but finding an efficient solution is made difficult by the constraints the author put on it. The question is as follows:

I have the following exercise: The numbers n0 to n7 are bytes represented in binary system. The task is every bit to drop either to the bottom or if it meets another bit it stays above it. Here is a visual example:

I realized that if I apply Bitwise OR on all the numbers from n0 to n7 it’s always the correct result for n7:

n7 = n0 | n1 | n2 | n3 | n4 | n5 | n6 | n7;
Console.WriteLine(n7); // n7 = 236

I looked at this suggestion and noted that n0 was equal to the bit-wise AND on all numbers.

n0 = n0 & n1 & n2 & n3 & n4 & n5 & n6 & n7;
Console.WriteLine(n0); // n7 = 0

I looked at these two clues and assumed that there was a symmetry to be had across all rows:

n7 = n0 | n1 | n2 | n3 | n4 | n5 | n6 | n7;
n6 = n0 | n1 | n2 | n3 | n4 | n5 | n6 & n7;
n5 = n0 | n1 | n2 | n3 | n4 | n5 & n6 & n7;
n4 = n0 | n1 | n2 | n3 | n4 & n5 & n6 & n7;
n3 = n0 | n1 | n2 | n3 & n4 & n5 & n6 & n7;
n2 = n0 | n1 | n2 & n3 & n4 & n5 & n6 & n7;
n1 = n0 | n1 & n2 & n3 & n4 & n5 & n6 & n7;
n0 = n0 & n1 & n2 & n3 & n4 & n5 & n6 & n7;

Boom. 25 points here I come. I received an upvote and found myself at + 1.
Then I was at 0.
Then I was at -1.

Confused, I looked over my answer and came to the realization it was completely wrong. If there are two numbers in n0 and n1, the above solution won’t account for them. It assumes the bits have already “fallen” into their correct position, which isn’t the case.

I quickly deleted the answer, embarrassed at my oversight and started thinking about the problem. Essentially, I wanted to count the number of ON bits in a column efficiently. There are a number of tricks to count the number of bits set in a given integer, but none that I knew of to count across integers. I considered adding, subtracting ANDing, ORing, XORing, and just about every operation that one might apply to an integer. Surely there was an efficient way to accomplish what seemed like an incredibly easy problem.

A few answers came in. They involved iterating over the collection multiple times. Some had the advantage of terminating early, but all repetitively churned through the collection multiple times, dropping bits at most one level at a time.

While the answers were all valid, something bugged me about them. It seemed like there had to be a more efficient solution. Something that didn’t need to loop over the whole collection multiple times. I tried to break the problem down. How might we solve it if it was just two numbers?

ImageWell, I already knew the answer to this. The top row is simply the AND of both, while the bottom is the OR of both.

n0 = n0 & n1;
n1 = n0 | n1;

Image

If we repeat this on another pair of two, we might get something that looks like:
ImageImageThis seems interesting because now we’ve guaranteed that each pair is completely solved. We can take advantage of this in two ways:
1. For each pair, if a topmost bit is set, we know the bottom-most bit is set.
2. For each pair, if a bottom-most bit is not set, the topmost bit is not set.

This allows us to merge the two pairs without checking each possible combination:

n0 = (n0_ & n2_);
n1 = (n0_ & n3_) | (n1_ & n2_);
n2 = (n0_ | n2_) | (n1_ | n3_);
n3 = (n1_ | n3_);

Essentially, we’ve created a divide and conquer algorithm and taken advantage of correct ordering when we merge the pieces. The rest of the algorithm can be seen here, but it basically just continues the pattern demonstrated above. While it’s not as simple as I had hoped it might be, I was happy to have come up with it.