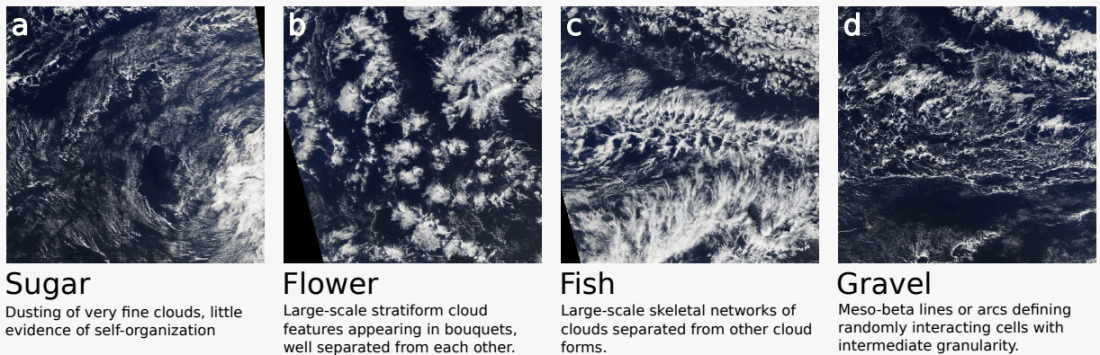
In the Understanding Clouds from Satellite Images Kaggle contest, competitors were challenged to identify and segment different cloud formations in a series of satellite photos. There were four different kinds of cloud formations we were tasked with identifying. The lines between them can be fuzzy at times, but they’re described as follows:
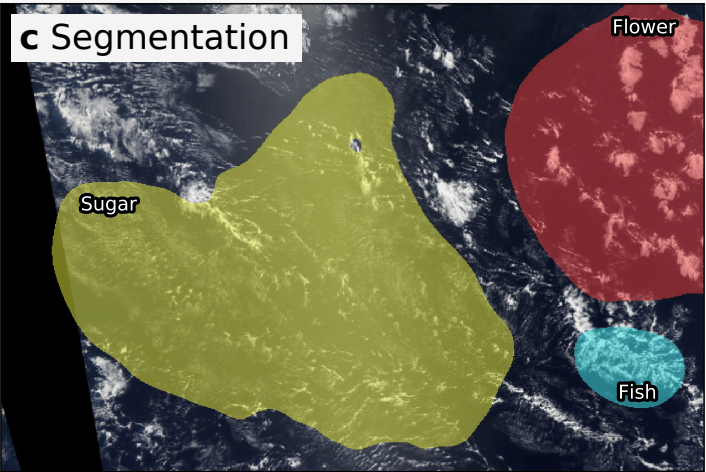
Given a satellite photo, we’re challenged to identify these formations and produce an output similar to:
Ultimately my solution received a score of 0.65571which put me at 137/1538 and earned me my second bronze medal on Kaggle (and makes me a “Kaggle Competitions Expert”).

What worked for me
My solution used a Feature Pyramid Network (FPN) with an efficientnet-b2 encoder. For data augmentation I used horizontal and vertical flipping as well as rotations and a small amount of zoom. I trained 10 folds and used vertical flipping and horizontal flipping for test-time augmentation. The image input size to my network was 448x672.
Feature Pyramid Networks
For much of this competition I tried various approaches with U-Nets, a common approach used to segment medical images. Only in the last month did I start to experiment with other approaches. I quickly found that FPNs lead to better segmentation performance on this problem.
Removed C2 and P2 Layers
The labels for this competition were created via crowdsourcing. Users were presented with a satellite image and asked to drag boxes around clouds that they believed fell into one of the four classes. As such the labels for this competition were generally large and rectangular:
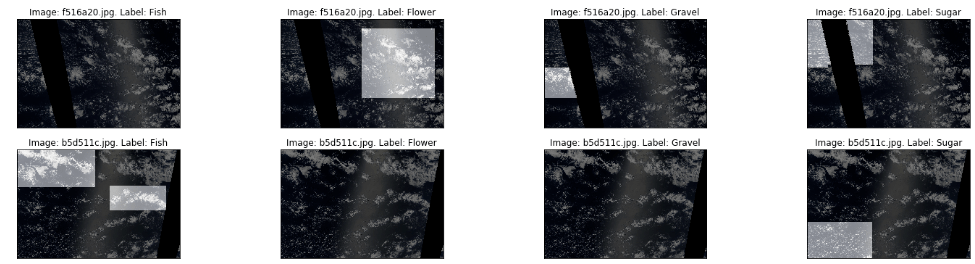
This observation lead me to believe that we would be better off making “large and rectangular” predictions. One way to encourage this would be to make predictions using more coarse layers of the FPN. This meant removing the C2 and P2 layers of the FPN. This simple change lead to an improvement of 0.005 CV and LB score.
EfficientNet
For most of this competition I experimented with ResNets. Toward the end of the competition I decided to give EfficientNet a shot and found that it drastically improved my score.
What did not work (for me)
Image Pairs
One insight I made early in this competition was that the test and train set had very similar images within them. For example here are two images taken only a few hours apart:
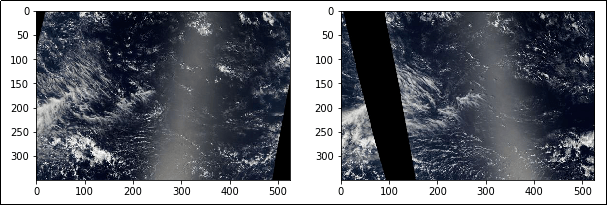
I figured that since we knew the labels for one of the images, we could use this information to help us label the other. Unfortunately I was not able to successfully use this information. It’s possible that the label noise (different people see different clouds in each photo) makes it too difficult for us to make use of these pairs. It’s equally possible that I made a mistake and should have spent more time investigating these pairs!
Pretraining
While training a model to find similar images, I downloaded over 12,000 additional images from NASA’s Earthdata repository. I figured that training a ResNet-50 to find similar images might help it learn to find useful features in satellite images that we could then use in our primary task. I tried to use these weights in my segmentation model but they did not noticeably improve my results. Once again I am not sure if I gave this idea enough attention, as it really seems like it should have worked.
What others did that worked
Classification head
Many of the most successful solutions used both a segmentation model and a classification model. The goal of the classification model was simply to remove entries from segmentation entirely. This ends up helping considerably because predicting any pixels for an empty label will instantly get you a dice score of zero on that example.
Max Pixel Value
Another clever approach was to ensure that your model always made at least one prediction for a given image. Every image has at least one class present, so it’s important not to submit any empty masks. Some users took the maximum pixel value from all classes on a given image and marked that class as present.
Comparing Output Distributions
Early on in this competition I learned how to calculate the expected output distributions for each class. (I even wrote a blog post about it!) Unfortunately I was either too lazy or too inexperienced to effectively make use of this knowledge. I should have been comparing my predicted output distribution with this expected test set distributions. This may have helped guide the creation of an effective classifier.
Overall this competition went well. I didn’t overfit the leaderboard and ended up moving up 48 positions and qualified for a bronze medal. That said I can’t help but feel a little bummed out that I wasn’t able to take advantage of the image pairs I identified early on. Hopefully I’ll be able to earn a silver or even gold medal in future competitions.
